Acid-Base Indicator: Theory with Examples
Acid-Base Indicator
Indicators(acid-base indicator) are substances that are used in quantitative analysis to obtain information about the completion of a chemical reaction. In other words, they are used to determine the end point of the reactions. There are many types of indicators.
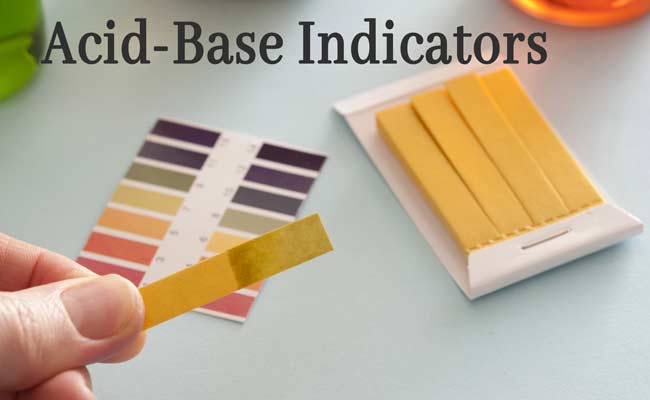
Acid base indicators are also called hydrogen ion indicators or neutralization indicators. The color of acid base indicators varies in acidic and alkaline mediums, that is, their color changes with appropriate change in pH value.
“Acid base indicators are those substances which have one color in acidic solution and another color in alkaline solution i.e. their color changes with proper change in pH value.”
pH range of acid-base indicators
The color of an acid base indicators depends on the pH of the solution. The color change of an acid base indicator does not occur at a fixed pH but occurs in a pH interval called the pH range.
Example: The pH range of phenolphthalein is 8.0 – 9.8. Hence the color change of phenolphthalein varies between these pH values.
- How p-n Junction Diode works : Forward and Reverse Biasing
- Semiconductors : How Semiconductor works and Types
- X-Rays – Production, Properties, Wavelength and Uses
- Daily use Chemical Compounds and Their Properties
- Hard Water and Soft Water : Permutit and Anion Exchange Resins
- Properties of Water :- Purification, Sources and Uses
- Hydrogen Chloride : Preparation, Properties and Uses
In solutions with pH less than 8.0, it is colorless and in solutions with pH of more than 9.8, its color is pink. Phenolphthalein is colorless in weak alkaline solution and pink in strong alkaline solution.
It is clear that it is not necessary that the color of an acid base indicator is the same in all alkaline solutions. Likewise, it is also not necessary. That the color of an acid base indicator be the same in all acidic solutions.
The pH ranges of some key indicators are given in the following table: –
Theory of Indicators
Two theories have been given to explain the behaviour of acid base indicators.
Ostwarld Theory
According to this theory, acid base indicator is either a weak carbanic acid and or a weak base. The unionized molecules of the indicators in the solution are of one color and the ions obtained by their separation are of another color. Due to weak electrolytes, their volume is reduced. Acidic indicator gives colorless anion and alkaline indicator colorless cation.
Example: phenolphthalein is a weak acid. It is colorless. On dissolving it in water, it is ionized into colorless H+ ions and pink anions. For convenience, we display it from HPh.
HPh(colorless) ⇋ H+(colorless) + Ph–(Pink)
In the presence of H+ ions in acidic medium, the ionization of HPh is very low due to the common ion effect, that is, the concentration of Ph– is very low and the solution remains colorless.
In alkaline medium, OH– ion obtained from the base combines with H+ ions obtained from HPh to form water. Water is a weak electrolyte and its ionization is very small.
This causes H+ to decrease and the equilibrium of the above equation is disturbed. The amount of ionization of HPh increases to restore equilibrium. Thus the concentration of Ph– ions in the solution increases and the color of the solution becomes pink.
HPh ⇋ H+ + Ph–
NaOH ⇋ Na+ + OH–
H + OH– ⇋ H2O
Na+ + Ph ⇋ NaPh
This theory also suggests that phenolphthalein is not a good indicator for the titration of strong acids and weak bases. In the final step of the titration, small amounts of OH– ion are obtained from the weak ionization of the weak base that they are not sufficient to displace the equilibrium reaction to the right.
Hence the pink color is not obtained in the solution at the end point of the reaction. In order to give the solution a pink color, an excess of weak base has to be added to the solution. In other words, the titration process is flawed.
Thus the color change of methyl orange can also be explained. Methyl orange is a weak base and thus dissociates –
MeOH(Yello) ⇋ Me+(Red) + OH–(colorless)
Due to the common ion effect in the presence of OH– ions in alkaline medium, ionization of MeOH is very low, ie the concentration of Me+ is very low and the color of the solution remains yellow.
H+ ion obtained from acid in acidic medium combines with OH– ions derived from MeOH to form water. Water is a weak electrolyte and its ionization is very small. This causes a decrease in the concentration of OH– ions and the equilibrium of the above equation is disturbed.
The amount of ionization of MeOH increases to restore equilibrium. Thus the concentration of Me+ ions in the solution increases and the color of the solution becomes.
MeOH ⇋ Me+ + OH–
HCl ⇋ H+ + Cl–
H + OH– ⇋ H2O
Me+ + Cl– ⇋ MeCl
- How p-n Junction Diode works : Forward and Reverse Biasing
- Semiconductors : How Semiconductor works and Types
- X-Rays – Production, Properties, Wavelength and Uses
- Daily use Chemical Compounds and Their Properties
- Hard Water and Soft Water : Permutit and Anion Exchange Resins
- Properties of Water :- Purification, Sources and Uses
methyl orange is not a good indicator for the titration of strong bases and weak acids. At the end point of titration, small amounts of H+ ion are obtained by the small ionization of weak acids that they are not sufficient to displace the equilibrium of the reaction to the right of the indicator.
Therefore, red color is not obtained in the solution at the end point of the reaction. To give the solution a red color, a high amount of weak acid has to be added to the solution. In other words the action of titration is flawed.
Quinonoid Theory
This theory is a modern theory to explain the working of indicators. According to this theory, indicator aromatic carbonic compounds used in acid base titrations are. They are a mixture of at least two movable forms.
Among these, one form is in acidic medium and the other form in alkaline medium in greater proportion. These two forms are called benzenoid and quinonoid forms. Both these forms have different colors. The color of the quinonoid form is darker than the color of the benzenoid form.
Therefore, when the pH value of a solution changes, there is a change in the benzenoid form to the quinonoid form or the quinonoid form to the benzenoid form causing a change in color.
- How p-n Junction Diode works : Forward and Reverse Biasing
- Semiconductors : How Semiconductor works and Types
- X-Rays – Production, Properties, Wavelength and Uses
- Daily use Chemical Compounds and Their Properties
- Hard Water and Soft Water : Permutit and Anion Exchange Resins
- Properties of Water :- Purification, Sources and Uses
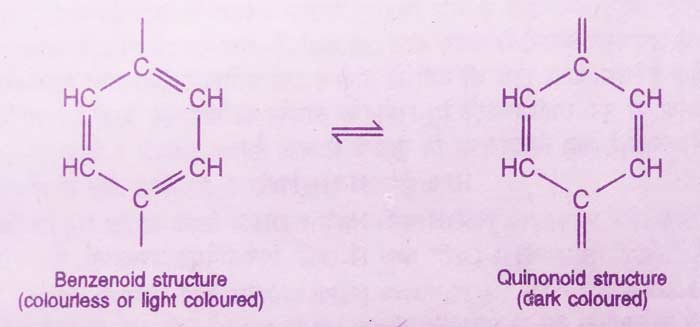


In the short form:-

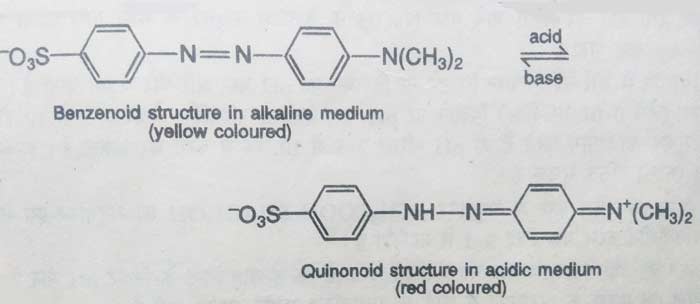
Similarly methyl orange is also found in two tautomeric forms. In acidic solution, this compound remains in quinonoid form and in alkaline solution it remains in benzenoid form. The color of quinonoid form is red and the color of benzenoid form is yellow orange. Therefore, the color of acidic solution of methyl orange is red and the color of alkaline solution is yellow orange.
Selection of appropriate Indicator in titration
In acid base measurements, there is a rapid change in pH near the equivalence point. The range of this change varies in the titrations of different acids and bases. The color of the indicator depends on the pH of the solution.
Therefore, no one indicator can be used for every titration. The choice of the indicator depends on its pH range and the range of change in pH near the equivalence point of titration. The proper indicator has the following symptoms in a titration.
- The color of the indicator should be changed by at least pH change.
- The color change must be permanent and the color changed should be contrasted.
- The color change must occur at the end point of the reaction.
The selection of appropriate indecators is based on the study of neutralization curves. The following is a description of the neutralization curves and the selection of appropriate indecators in different measurements.
Measurement of strong acid from a strong base
The titration of HCl with NaOH is an example of this category. If the change in pH after adding N / 10 NaOH solution to a 25 ml N / 10HCl solution can be determined by calculation or by pH meter and a graph is drawn between the volume and pH of NaOH, then this type of curve is obtained.
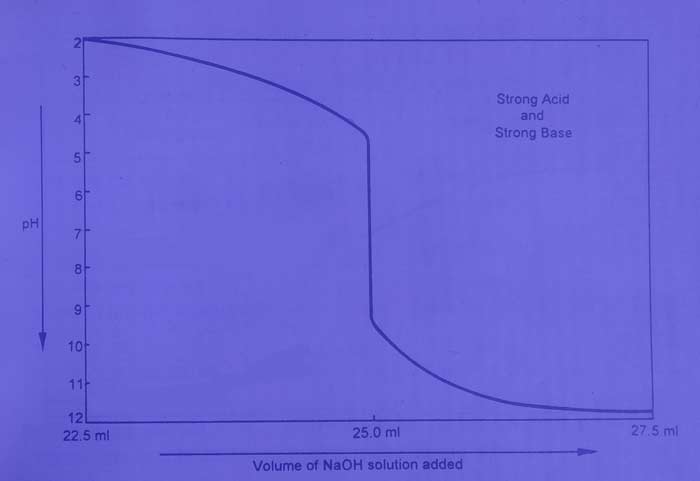
The pH value of the solution increases gradually when the base solution is added to the acid solution. On adding acid content (01ml) of base near the equivalence point, the pH value changes rapidly from 4 to 10. Therefore, in this titration, we use an indicator that can work in the pH range 4 to 10. The methyl orange, Phenolphthalein, Bromothymol Blue and methyl red are the proper indicators for this.
Measurement of strong acid from weak base:
Measurement of HCl with NH4OH is an example of this category. If the change in pH after adding N / 10 NH4OH solution to a 25 ml N / 10 HCl solution can be determined by calculation or by pH meter and a graph is drawn between the volume and pH of NH4OH, then this type of curve Is obtained.

The pH value of the solution increases gradually when the base solution is added to the acid solution. The pH value changes rapidly from 4 to 6.5 when the acid content (0.01ml) of the base near the equivalence point is added. Therefore, in this titration, we use an indicator that can work in the pH range from 4 to 6.5. The methyl orange, methyl red is the proper indicator for this.
Measurement of weak acid from strong base:
CH3COOH titration with NaOH is an example of this category. If the change in pH after adding N / 10 NaOH solution to a 25 ml N / 10 CH3COOH solution is determined by calculation or by a pH meter and a graph is drawn between the volume and pH of NaOH, then this type of curve Is obtained.

The pH value of the solution increases gradually when the base solution is added to the acid solution. On adding acid content (0.01ml) of base near the equivalence point, the pH value rapidly changes from 7.5 to 10. Therefore, in this titration, we use an indicator that can work in the pH range 7.5 to 10. The methyl orange is the proper indicator for this.
Measurement of weak acid from weak base:
Measurement of CH3COOH with NH4OH is an example of this category. If this graph is drawn between the volume and pH of NH4OH, this type of curve is obtained.
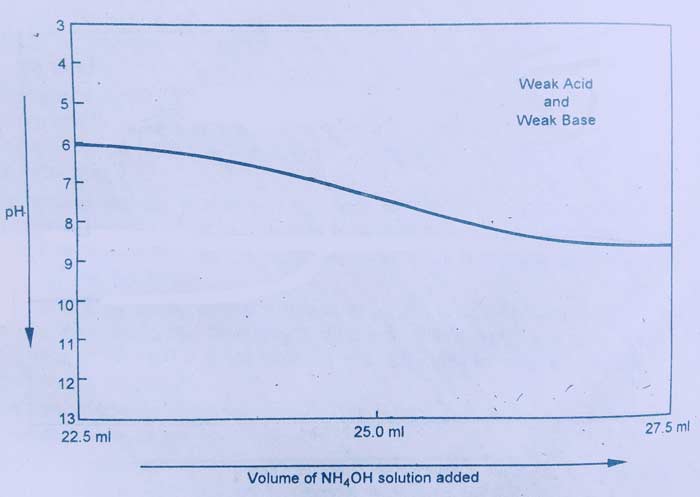
The depolarization curve of this titration shows that there is no sharp change in the pH value near the equivalence point. For this reason, no chemical indicator is suitable in the titration of this light.
Based on the above description, indicators for various acid base measurements are included in the following array –
| Titration | pH Range | Suitable Indicator | pH Range of color Change | |
|---|---|---|---|---|
| 1 | Strong acid and Strong base example: HCl and NaOH | 4 -10 | Phenolphthalein Methyl Orange Methyl Red Bromothymol Blue | 8.0 - 9.8 3.1 - 4.5 4.2 - 6.3 6.0 - 7.6 |
| 2 | Strong acid and Weak base Example: HCl and NH₄OH | 4 - 6.5 | Methyl Orange Methyl Red | 3.1 - 4.5 4.2 - 6.3 |
| 3 | Weak acid and Strong base Example: CH₃COOH and NaOH | 7.5 - 10 | Phenolphthalein Thymol blue | 8.0 - 9.8 8.1 - 9.6 |
| 4 | Weak acid and Weak base Example: CH₃COOH and NH₄OH | No Changes | NA | - |
Universal Indicator
Mixing of several indicators into each other, such mixtures can be prepared that display different colors in mediums with different pH values. A mixture of such indicators is called universal indicator.
Example: Kolthoff is a universal indicator. It is a mixture of 5 different indicators called methyl red, α-naphthalene, thymolphthalein, phenolphthalein, bromothymol blue. This mixture exhibits particular color at particular pH.
This mixture is red color at pH = 4, orange color at ph = 5, yellow color at pH = 6, green yellow color at pH = 7, green color at pH = 8, blue green color at ph = 9, pH = 10 Blue displays violet color and red violet color at pH = 11. Universal indicator cannot be used for all reactions. It is used only in special circumstances for certain reactions.
